Policy Brief
Why Gen-Z Is Rising
Erica Chenoweth and Matthew Cebul analyze the global surge of Gen Z-led protest movements, showing how economic insecurity, exclusion from power, and corruption are driving youth mobilization worldwide.
Commentary
Under the Trump administration, what did Americans protest about?
Under the Trump administration, what did Americans protest about?
The Crowd Counting Consortium’s compiled dataset offers a few ways to answer this question. Each of the more than 61,000 records in the dataset so far represents a separate event, and each of those records includes a field summarizing what the event was about, as understood and recorded in words by CCC’s human coders.
One of the simplest ways to try to spot patterns in those claims is to break them into individual words; toss all those words into one metaphorical bag; count the number of times each word appears in that bag; and then compare those counts.
The word cloud below shows what happens when we do just that. In the cloud, word position is essentially arbitrary, but the size of each word represents its relative frequency, so more common terms appear larger. Words that don’t have political meaning, like “the” and “of”, were dropped before the tallying; plural forms were singularized; and words that occurred fewer than 10 times have been dropped the figure.

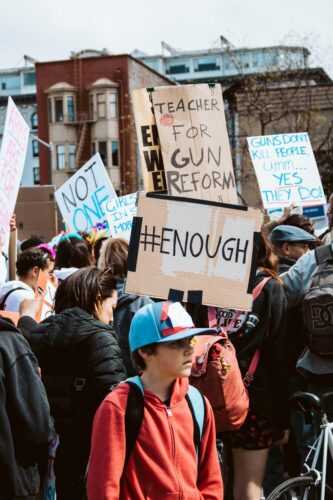
I think the resulting image does a nice job highlighting major themes in protest activity under Trump. For example, the Black Lives Matter that began in 2020 is probably the broadest and widest mobilization in U.S. history, so it’s no surprise to see “racism”, “police”, “violence”, and “brutality” pop out of the cloud. Meanwhile, the tsunami of student walkouts after the Parkland attack in 2018 represents the broadest single-day event in U.S. history—walkouts occurred at nearly 5,000 institutions across the country—and we see traces of those events and similar ones in “gun”, “control”, and “school”. The latter also gets a boost from COVID-related protests, many of which have argued for or against resuming in-person learning or school sports during the pandemic.
Unfortunately, this simple word-counting approach doesn’t work so well at the level of individual events, or for tracking trends in protest themes over time. To do those kinds of things, we need to move up a rung or two on the ladder of abstraction, reducing and structuring the data even further.
We accomplish this in the compiled version of the CCC dataset by associating each event’s claims with recurrent issues in American politics. When compiling the data, we also run the coder’s summaries of protesters’ claims through a series of regular expressions representing nearly 35 major political themes—things like ‘racism’, ‘education’, ‘guns’, ‘reproductive rights’, and, since 2020, ‘covid’. Each regular expression, or regex, looks in the Claim field for a set of words or phrases associated with the issue in question and, if it sees any of them, attaches a tag for that issue to that event.
Once those issue tags have been attached, we can use them to group or filter events for analysis. The simplest thing to do at this point is just to count the number of times each tag appears in the data.
The column chart below shows the results of that exercise for the 60,000+ events that occurred during the Trump presidency. Consistent with the word cloud, we see that racism, policing, guns, and education (schools) were the most common themes of U.S. protest activity over the past four years. Now, however, we can also see more clearly the prominence of other recurrent issues such as immigration, the environment, women’s rights, democracy (including voting rights), COVID-19, and the presidency and Trump himself (“executive”).

To see how activism around those themes has trended over time, we need to group events by time step as well as issue. The set of small multiples below does that, grouping here by month. Because the ranges of daily counts vary so widely across issues—some peak in the thousands, others in the tens—I’ve chosen not to standardize the scale of the y-axis across the charts, but the x-axes all span the same time period. The charts are arranged alphabetically by issue tag.

There’s a lot going on in that stack of charts. Picking just a few to focus on, though…
Together, these three charts offer a solid high-level overview of major themes in protest activity under the Trump administration. I also hope this post shows some of the ways the CCC dataset can be used to identify and analyze patterns in U.S. activism at various levels of abstraction, from reading a news story about, or even watching video footage of, a specific event (see the links in the ‘source_’ columns of the compiled dataset), to reading CCC coders’ summaries of protester claims, to using natural language processing techniques to summarize those summaries into features we can tally and compare at higher levels of abstraction.
If you’d like to replicate or expand on the analysis described in this post, you can find the R code used to generate these charts in the Nonviolent Action Lab’s GitHub repository, here.
Policy Brief
Erica Chenoweth and Matthew Cebul analyze the global surge of Gen Z-led protest movements, showing how economic insecurity, exclusion from power, and corruption are driving youth mobilization worldwide.
Occasional Paper
In this report, Matthew Cebul, Lead Research Fellow for the Nonviolent Action Lab, examines the effectiveness of nonviolent action movements in supporting democratic resilience globally. Identifying challenges faced by nonviolent pro-democracy movements, Cebul offers key takeaways for combating accelerating democratic erosion in the US and abroad.
Article
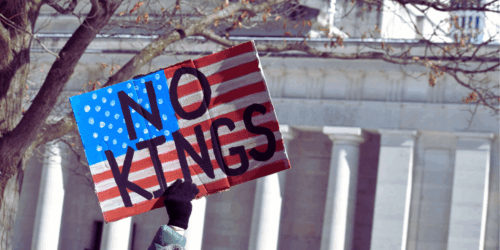
As organizers for No Kings 2 seek historic turnout on October 18, the broader pro-democracy movement has already broken new ground.
Policy Brief
Erica Chenoweth and Matthew Cebul analyze the global surge of Gen Z-led protest movements, showing how economic insecurity, exclusion from power, and corruption are driving youth mobilization worldwide.
Occasional Paper
In this report, Matthew Cebul, Lead Research Fellow for the Nonviolent Action Lab, examines the effectiveness of nonviolent action movements in supporting democratic resilience globally. Identifying challenges faced by nonviolent pro-democracy movements, Cebul offers key takeaways for combating accelerating democratic erosion in the US and abroad.
Article
In this op-ed, Liz McKenna examines the second ‘No Kings’ protest on October 18 and offers strategies for translating successful protest movements into influential policy change. She emphasizes the importance of sustained organizational efforts alongside protest activity to engage actors across partisan lines, building a broad coalition and a durable base for the movement.


