Policy Brief
AI for Democracy Movements: Toward a New Agenda
A new report summarizes key insights from the Nonviolent Action Lab’s December 2025 convening on how artificial intelligence can empower pro-democracy movements.
![]()
Commentary
Just how large and broad was that wave of protests after the death of George Floyd? How destructive was it? And how did police and right-wing counter-protesters respond to it?
By:
 Jay Ulfelder
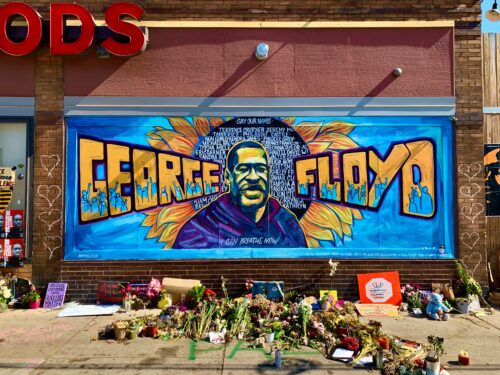
We all know that the killing of George Floyd by Minneapolis police officers on May 25, 2020, triggered a tsunami of protest activity across the United States.
Just how large and broad was that wave of protests, though? How destructive was it? And how did police and right-wing counter-protesters respond to it?
The Crowd Counting Consortium’s dataset represents one of the most comprehensive sources on U.S. protest activity over the past four years, including the George Floyd uprising. I’m going to use that dataset to answer the questions I just posed in a moment, but I want to preface this exercise with three caveats.
Okay, so, with those important caveats attached, what do the data we’ve collected so far tell us about the contours of the George Floyd uprising?
For starters, we can confirm that it has been massive. CCC’s dataset includes nearly 12,000 anti-racism events in the U.S. since May 25, 2020, or nearly 20 percent of all protest events in the country over the past four years. By our (conservative) count, those events involved roughly 2.7 million participants, and, for the reasons noted above, the true number is surely much higher.
In addition to its sheer size, a key feature of the George Floyd uprising was the pace and breadth of the spread in activity associated with it. So far, CCC has recorded anti-racism events in an astonishing 3,113 different U.S. cities and towns since Floyd’s death. Remarkably, more than 2,800 of those localities saw anti-racist activism in just the four weeks after May 25.
As that number suggests and as the chart below shows, activism in support of the Black Lives Matter message diffused quickly. The wave peaked on Saturday, June 6, just two weeks after Floyd was killed, with more than 700 events in over 600 different cities and towns. The next day saw another 518 events in more than 400 localities. The wave gradually receded over the ensuing several weeks, eventually settling into a pattern in many cities that involved daily or weekly marches and demonstrations with fewer participants than that initial surge but a persistent focus on calls for racial justice and Black empowerment and opposition to police violence.

We can also use maps to visualize the speed and breadth with which the George Floyd uprising spread across the country in May and June. The gif below animates a sequence of maps from May 26 to June 30, 2020. In those maps, each point represents an anti-racism protest, and the size of the point is crudely proportionate to the size of the crowd. (Events with no reported crowd size get the same-sized point as events with tens of participants, and apologies to Alaska and Hawaii for leaving them out).

Now, how destructive was the George Floyd uprising?
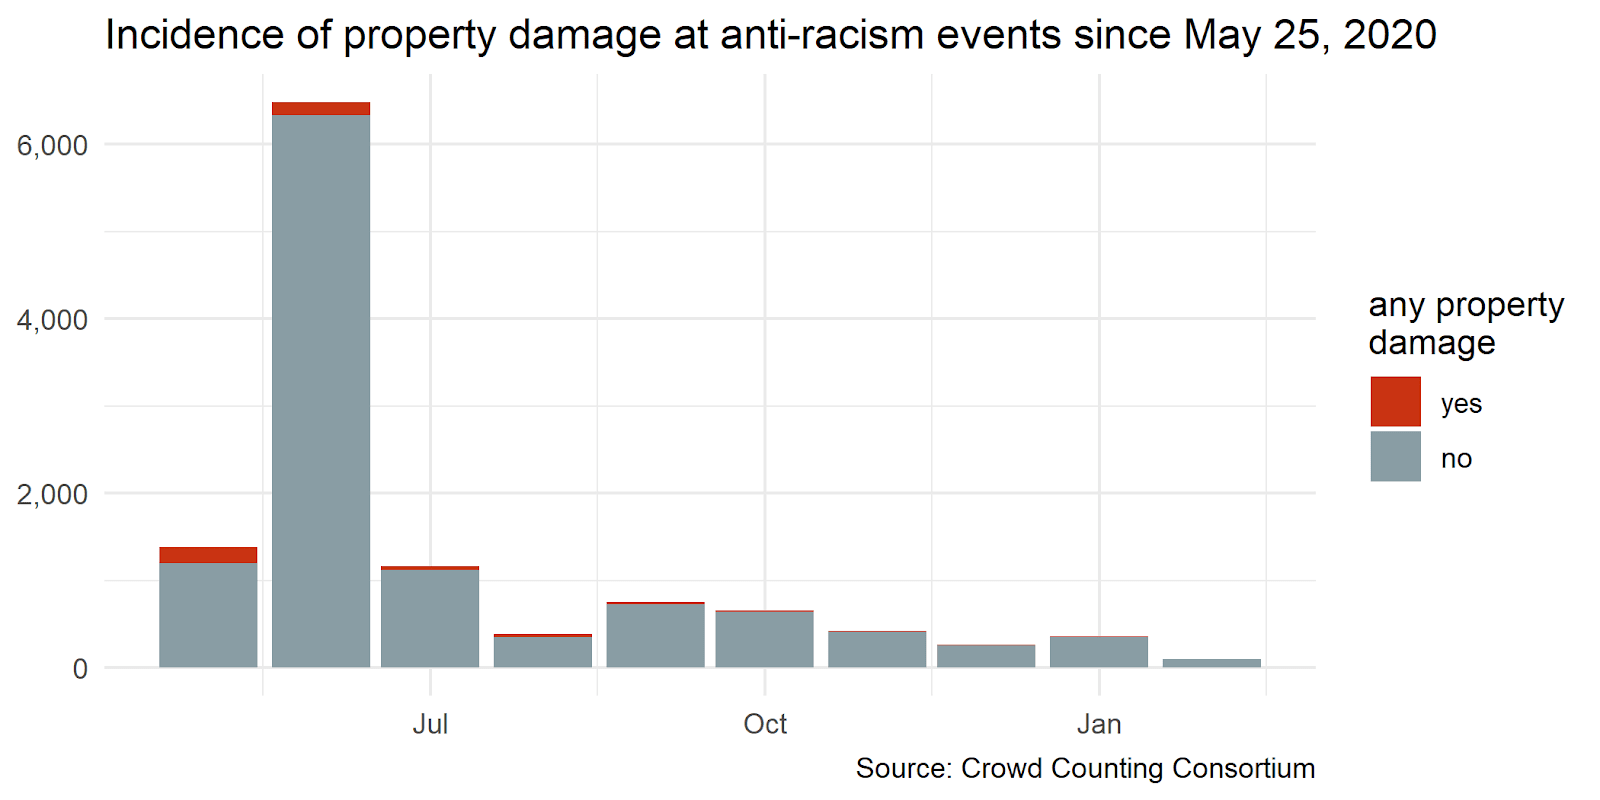
If you follow right-wing news outlets or listened to many Republicans’ stump speeches last fall, you have heard that the Black Lives Matter protests of the past eight months have been exceptionally destructive. The CCC dataset does not capture the scale of destruction associated with protest events, but it does indicate whether or not any property damage occurred, including minor vandalism such as broken windows or graffiti as well as larger-scale damage or looting.
By that measure, nearly all events associated with this uprising were not destructive at all. More than 96 percent of the nearly 12,000 events in our dataset involved no reported property damage. As the chart below shows, the vast majority of the events that did involve property damage occurred in the uprising’s initial wave in May and June 2020; since then, reports of property damage associated with anti-racism protests in the U.S. have been extremely rare.
And what does the CCC dataset tell us about how police responded to these events?
As with property damage, we can’t readily quantify the intensity of the response from police and political rivals, but we can say some things about the frequency with which they took certain actions.
Finally, what about those counter-protesters?
One notable feature of the George Floyd uprising was the backlash it inspired, not just from police but also from other civilians. CCC data capture this backlash in several forms, including the rapid growth of the Back the Blue counter-campaign over the summer of 2020 and the increased frequency with which far-right militant groups organized or participated in protests and other demonstrations or direct action over the latter half of the year.
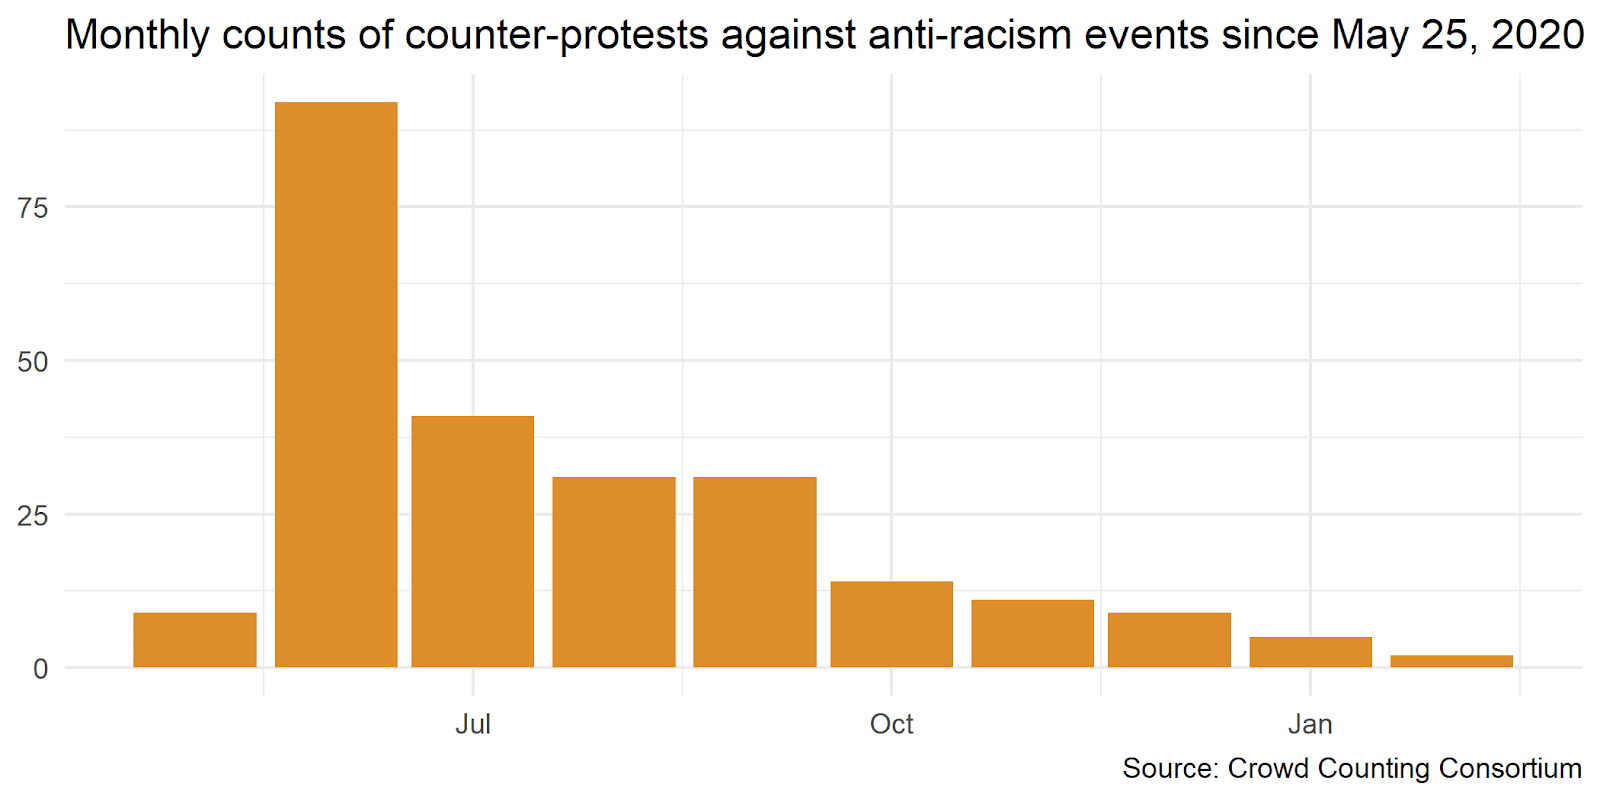
One of the most obvious manifestations of this backlash, though, were the direct counter-protests that occurred at many events—cases where people gathered at demonstrations calling for racial justice for the specific purpose of rejecting or rebutting their anti-racism message. So far, we’ve recorded 245 of those since May 25, 2020, and that is almost certainly a low estimate, as counter-protesters did not always reference racism in their claims (or coders did not record them as such).
As the chart below shows, while the rate at which these counter-protests occurred generally follows the same trajectory as the George Floyd uprising, they have tapered off more slowly. Some of these counter-protests ostensibly focused on the protection of property, especially early in the uprising, when images of rioting in dominated coverage of anti-racist activism; many expressed support for police officers and law enforcement, sometimes but not always mixing that message with support for President Trump; and some led to violent or even fatal confrontations.
In sum, CCC data confirm that the wave of anti-racism protest activity following the killing of George Floyd has been massive and widespread; has very rarely been destructive; and has spurred backlashes in the forms of aggressive policing and right-wing counter-mobilization.
We’ll dig deeper into the data on mobilization and counter-mobilization around racism in the U.S. in future posts. Meanwhile, if you’d like to replicate or expand on this analysis, you can find the R code used to generate the charts in this post in the Nonviolent Action Lab’s GitHub repository, here.
Policy Brief
A new report summarizes key insights from the Nonviolent Action Lab’s December 2025 convening on how artificial intelligence can empower pro-democracy movements.
Additional Resource
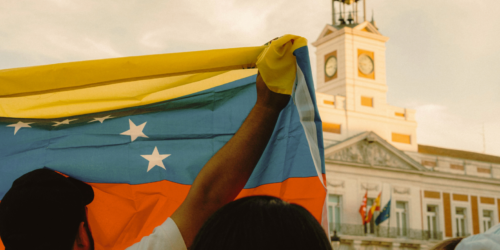
Even with Nicolás Maduro gone, the fight for Venezuela’s future is far from over. Freddy Guevara warns that Maduro’s successors are more interested in regime survival than democratic reform.
Policy Brief
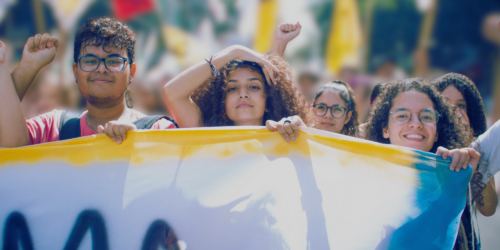
In this essay, originally published in the Journal of Democracy, Erica Chenoweth and Matthew Cebul analyze the global surge of Gen Z-led protest movements, showing how economic insecurity, exclusion from power, and corruption are driving youth mobilization worldwide.
Policy Brief
In this essay, originally published in the Journal of Democracy, Erica Chenoweth and Matthew Cebul analyze the global surge of Gen Z-led protest movements, showing how economic insecurity, exclusion from power, and corruption are driving youth mobilization worldwide.
Occasional Paper
In this report, Matthew Cebul, Lead Research Fellow for the Nonviolent Action Lab, examines the effectiveness of nonviolent action movements in supporting democratic resilience globally. Identifying challenges faced by nonviolent pro-democracy movements, Cebul offers key takeaways for combating accelerating democratic erosion in the US and abroad.
Article
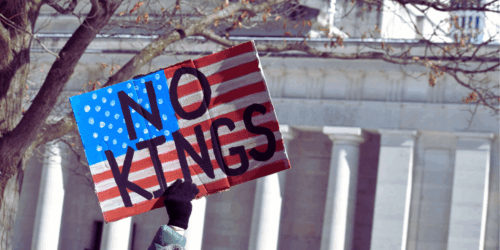
In this op-ed, Liz McKenna examines the second ‘No Kings’ protest on October 18 and offers strategies for translating successful protest movements into influential policy change. She emphasizes the importance of sustained organizational efforts alongside protest activity to engage actors across partisan lines, building a broad coalition and a durable base for the movement.