Policy Brief
AI for Democracy Movements: Toward a New Agenda
A new report summarizes key insights from the Nonviolent Action Lab’s December 2025 convening on how artificial intelligence can empower pro-democracy movements.
![]()
Commentary
Crowd Counting Consortium data show more than 3,700 days with pro-Palestinian protest activity at over 500 U.S. schools since October 7, 2023, including encampments at more than 130 of them.
By:
 Jay Ulfelder
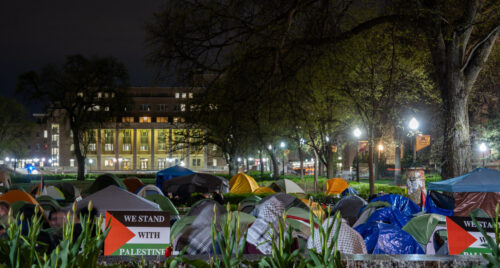
Since late April 2024, pro-Palestinian protest actions on U.S. campuses have drawn a lot of attention from the media, along with intense scrutiny from school administrators and elected officials. As part of its ongoing research on U.S. protest events, the Crowd Counting Consortium (CCC) — a collaboration between the Ash Center’s Nonviolent Action Lab and the University of Connecticut — has closely tracked these actions as well. This post offers an occasional update on what we’ve seen so far.
CCC data show several thousand days with pro-Palestinian protest activity at hundreds of U.S. public and private schools since October 7, 2023, including encampments at more than 130 of them. The most common demands at these actions have been calls for an end to genocide in Gaza, for Palestinian liberation, and for schools to disclose and divest from financial ties to Israel and weapons manufacturers. Throughout this eight-month wave, organizers have drawn explicit parallels between their goals and tactics and those of students and campus workers who mobilized against apartheid in South Africa in the 1980s. Only a few dozen of these thousands of protest days have seen property damage or injuries to police or counter-protesters. Despite that fact, many public figures continue to describe the protests as violent, and police have arrested more than 3,600 participants in them, or an average of nearly one per protest day. Our data also show that protest participants have been injured by police or counter-protesters — sometimes severely — about as often as protesters have caused property damage, much of which has been limited to graffiti.
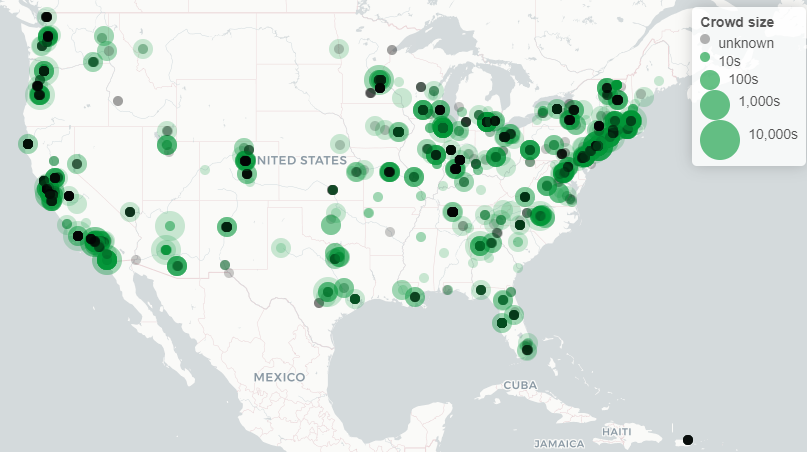
For the past seven years, CCC has used online news sources and posts to several social media platforms to track and make structured data about U.S. political protest activity. The resulting dataset now contains nearly 190,000 records with details on protest events — or, in the case of events that span multiple days, protest days — from thousands of cities and towns across all 50 U.S. states, Puerto Rico, Guam, the U.S. Virgin Islands, and the District of Columbia.
Since October 7, 2023, CCC has logged more than 3,700 days with protest activity at 525 different colleges, universities, K-12 schools, and school district offices across 317 different U.S. cities and towns.
While nearly 2,200 of those school protest days came on or after April 17, 2024 — the day the Gaza Solidarity Encampment launched at Columbia University — more than 1,500 of them, or about two-fifths, came earlier. As shown in the chart below, this wave of pro-Palestine campus activity began almost immediately after October 7, 2023; crescendoed in late April and early May of 2024; and continues apace, even as many U.S. schools have already entered final exam periods or begun their summer breaks.
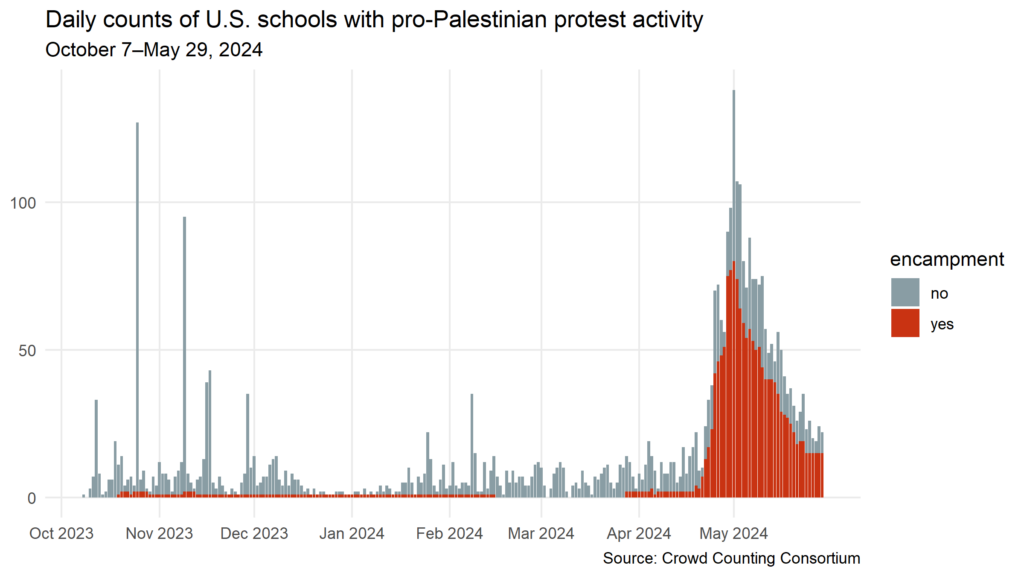
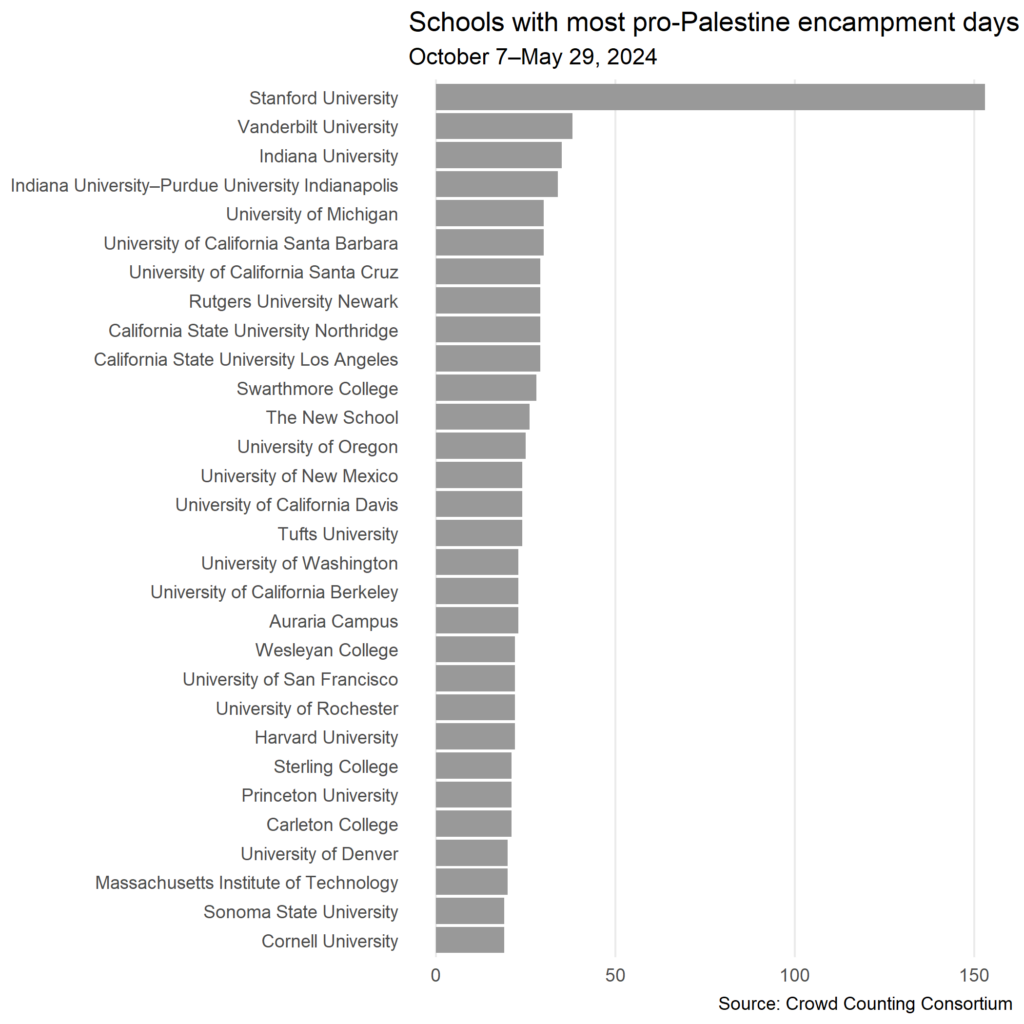
While campus encampments have drawn the most attention, they account for less than half of the pro-Palestine protest days we’ve logged at U.S. schools over the past eight months — 1,639 of 3,704, or 44 percent. As the previous chart shows, they also began popping up in mid-October 2023, not mid-April 2024. The longest-running encampment was actually Stanford University’s Sit-In to Stop Genocide, which stood in White Plaza for more than 120 days, from October 20, 2023, until mid-February 2024. With a second encampment running at White Plaza since late April, Stanford has now seen students camping in solidarity with Palestine for more than 150 of the past 235 days. As shown in the chart below, public colleges and universities from several states are about as well represented among campuses with the most encampment days as private ones are, and Columbia’s 13-day run doesn’t even make the top 30.
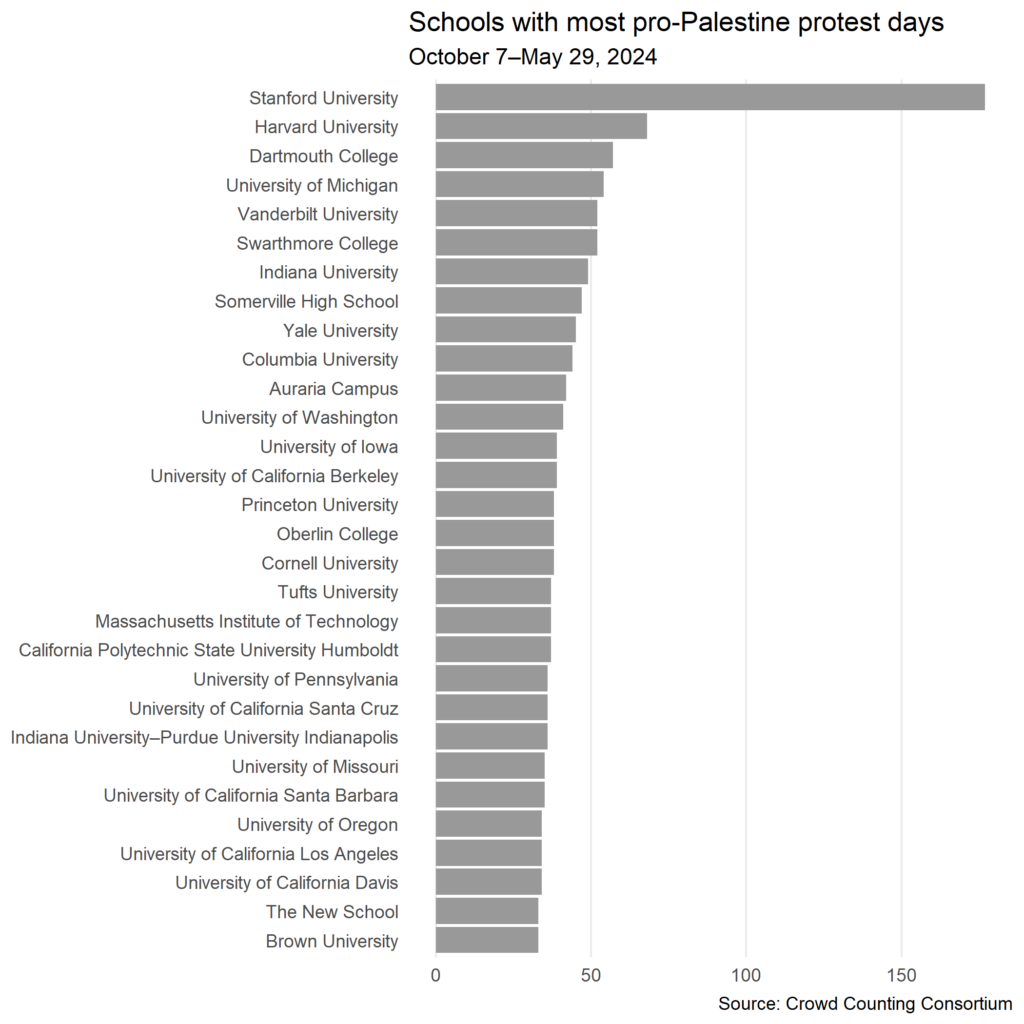
When we widen the aperture to consider protest actions of any kind, not just encampments, the representation of public vs. private schools doesn’t change much, but the names of the schools do. Now we see Columbia in the top 30, along with places like Dartmouth College, where students and faculty have continued to hold space daily after police forcibly swept an encampment almost as soon as it went up, and Somerville (MA) High School, where parents and community members demonstrated each weekday morning for several weeks this spring semester.
Administrative and police responses to these protests in general, and the encampments in particular, have varied widely. While we don’t (yet) have reliable data on variation in administrative responses across all 500+ schools, we can say that, in reading and watching the reports on these actions, we have seen everything from empathetic acceptance and negotiation to overt hostility and even violent reaction, including numerous cases that slid from the former to the latter as protest activity persisted and bumped up against other prominent events (e.g., graduations, reunions, and Congressional hearings). Responses to encampments in particular have generally followed one of three trajectories: 1) tolerance and negotiation until students voluntarily decamped, sometimes but not always under an agreement with administrators; 2) begrudging tolerance until some critical juncture when police were called in to dismantle the camp, almost always around dawn; or 3) immediate and aggressive hostility, with police and staff sweeping the camp almost as soon as it was put up. In addition to the aforementioned Dartmouth, examples of the latter include (but are not limited to) SUNY New Paltz, University of New Hampshire, University of South Florida, and University of Utah.
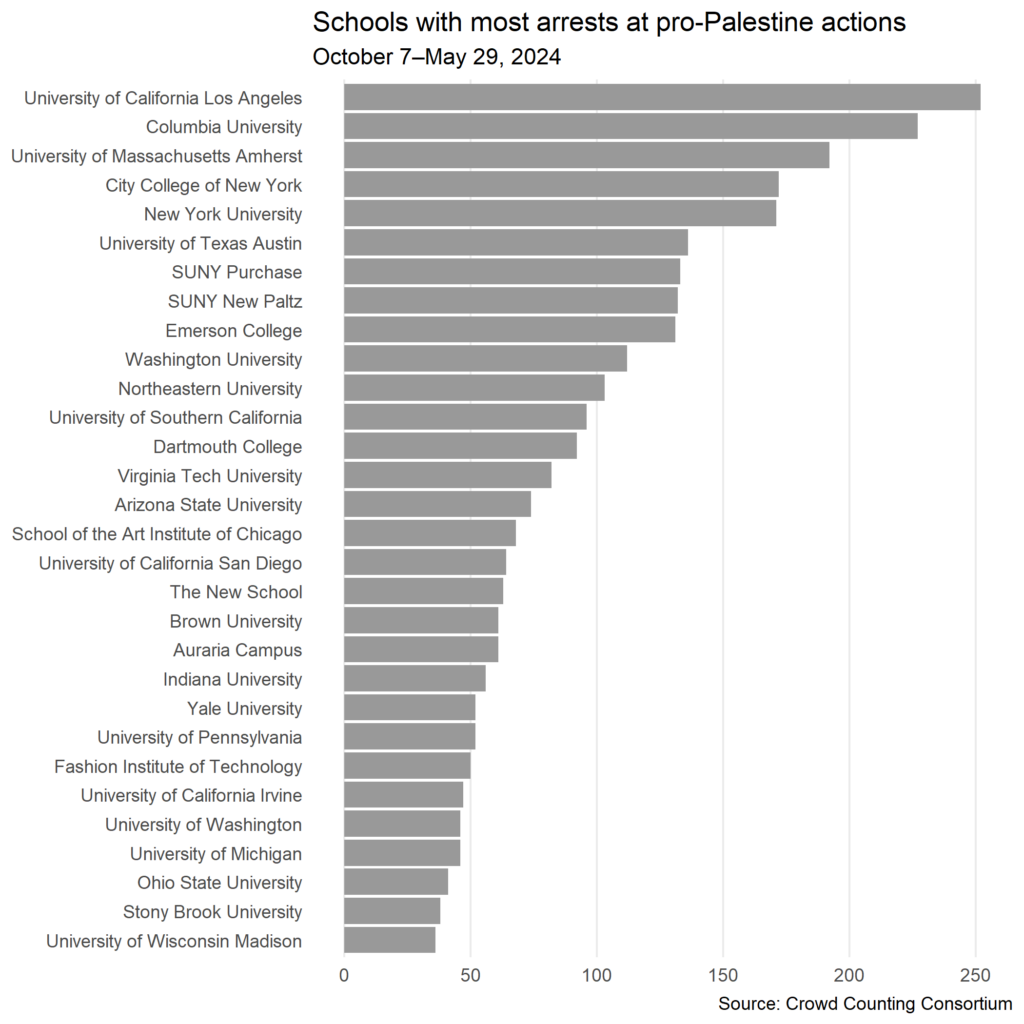
As noted at the top, across these roughly 3,700 protest days at U.S. schools since October 7, we have tallied 3,645 arrests, or nearly one per protest day. The chart below shows that UCLA has seen the most arrests, more than 250 in total, most of which occurred during the police action to demolish the encampment just one day after it was violently attacked in the dark by hundreds of counter-protesters. In fact, a quick scan of the names in that chart reveals an intriguing fact: while Republican governors such as Greg Abbott (Texas) and Ron DeSantis (Florida) may be more openly hostile to left-leaning protesters than their Democratic counterparts, many of the schools with the most arrests of pro-Palestinian protesters over the past eight months sit in cities led by Democratic mayors located in states led by Democratic governors. Three of the five schools with the most arrests are in New York City, and five of the top 15 are in New York state. Another three of the top 15 are in Boston, and two (including UCLA) are in Los Angeles.
That pattern is probably due, at least in part, to differences across campuses, cities, and states in the intensity of the mobilization for this cause. It does not apparently correlate with variation in the scale of property damage or person-on-person violence associated with these actions. In fact, our data show very little of both of those. We’ve seen reports of property damage at only 33 of those more than 3,700 on-campus protest days, and of police injuries at only eight, all of those during police actions to clear encampments or break up other demonstrations. Meanwhile, we’ve seen reports of injured pro-Palestinian protesters 36 times, some at the hands of police and others at the hands of counter-protesters, who have appeared at more than 300 of these protest days, or about 8 percent.
That’s where things stand according to our data and as of May 29, 2024, anyway. We will continue to track this movement and broader U.S. protest activity as we always do, and we will provide additional updates as time and interest permit. In the meantime, if you’d like to explore the data on your own, you can use our regularly updated interactive dashboard for this particular movement, or you can download the entire dataset from 2017 to the present from our GitHub repository.
Policy Brief
A new report summarizes key insights from the Nonviolent Action Lab’s December 2025 convening on how artificial intelligence can empower pro-democracy movements.
Additional Resource
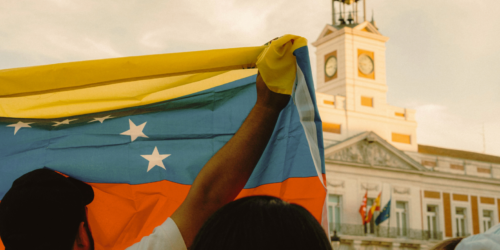
Even with Nicolás Maduro gone, the fight for Venezuela’s future is far from over. Freddy Guevara warns that Maduro’s successors are more interested in regime survival than democratic reform.
Policy Brief
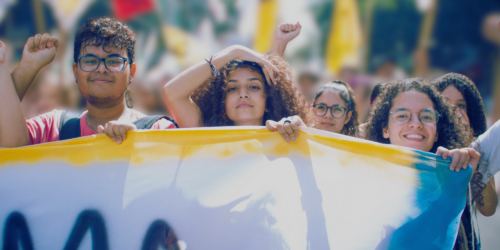
In this essay, originally published in the Journal of Democracy, Erica Chenoweth and Matthew Cebul analyze the global surge of Gen Z-led protest movements, showing how economic insecurity, exclusion from power, and corruption are driving youth mobilization worldwide.
Policy Brief
In this essay, originally published in the Journal of Democracy, Erica Chenoweth and Matthew Cebul analyze the global surge of Gen Z-led protest movements, showing how economic insecurity, exclusion from power, and corruption are driving youth mobilization worldwide.
Occasional Paper
In this report, Matthew Cebul, Lead Research Fellow for the Nonviolent Action Lab, examines the effectiveness of nonviolent action movements in supporting democratic resilience globally. Identifying challenges faced by nonviolent pro-democracy movements, Cebul offers key takeaways for combating accelerating democratic erosion in the US and abroad.
Article
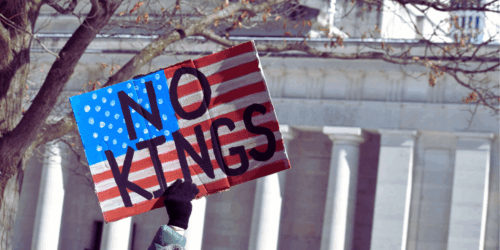
In this op-ed, Liz McKenna examines the second ‘No Kings’ protest on October 18 and offers strategies for translating successful protest movements into influential policy change. She emphasizes the importance of sustained organizational efforts alongside protest activity to engage actors across partisan lines, building a broad coalition and a durable base for the movement.