Policy Brief
AI for Democracy Movements: Toward a New Agenda
A new report summarizes key insights from the Nonviolent Action Lab’s December 2025 convening on how artificial intelligence can empower pro-democracy movements.
![]()
Commentary
To make it easier to find up-to-date information on pro-Palestine and pro-Israel protest activity in the United States since October 7, 2023, the Crowd Counting Consotium recently created a pair of interactive data dashboards separately covering the two.
By:
 Jay Ulfelder

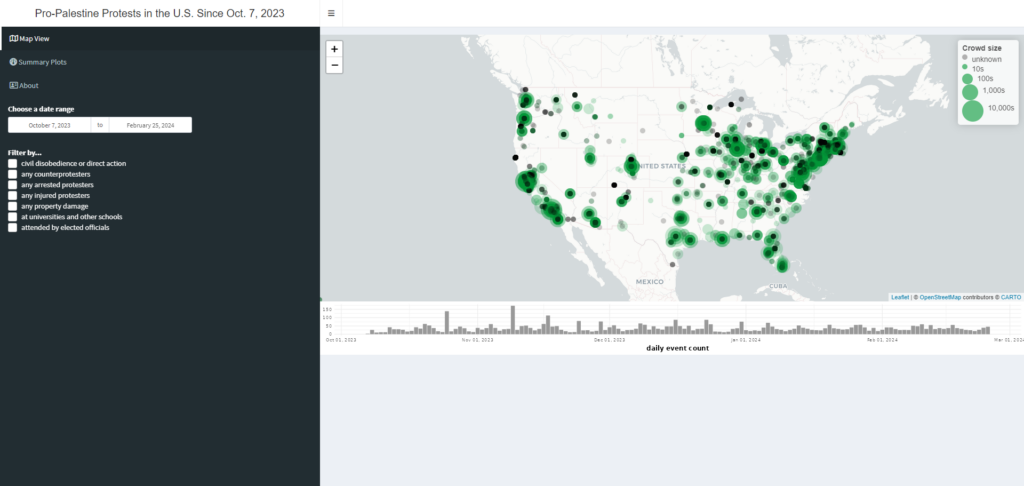
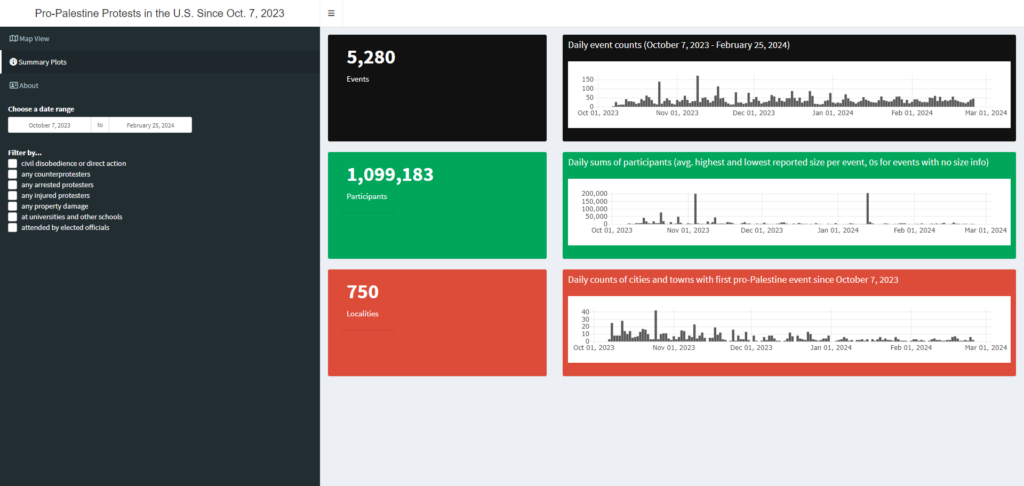
To make it easier to find up-to-date information on pro-Palestine and pro-Israel protest activity in the United States since October 7, 2023, we recently created a pair of interactive data dashboards separately covering the two. You can access the dashboards by clicking on these links.
Pro-Palestine Protests in the U.S. Since October 7, 2023
Pro-Israel Protests in the U.S. Since October 7, 2023
Both dashboards show an interactive map on the landing page.
To see summary statistics about the relevant set of events, click on the “Summary Plots” button in the menu on the left. It shows a count of events, the sum of the observed crowd sizes, and a count of the different cities and towns in which the events have occurred.
If you explore the data and think we’ve either missed an event or misrepresented one, please use our anonymous online form to submit relevant public information, and we’ll review and amend as required.
We expect to update the underlying data on a daily or near-daily basis for the forseeable future, and the upper limit of the data range available in the controls will always let you know when it was last refreshed.
Policy Brief
A new report summarizes key insights from the Nonviolent Action Lab’s December 2025 convening on how artificial intelligence can empower pro-democracy movements.
Additional Resource
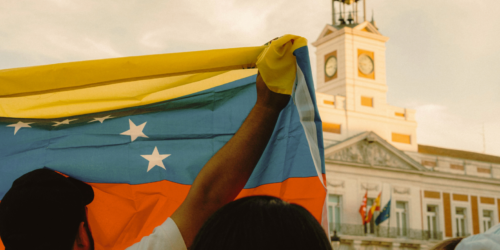
Even with Nicolás Maduro gone, the fight for Venezuela’s future is far from over. Freddy Guevara warns that Maduro’s successors are more interested in regime survival than democratic reform.
Policy Brief
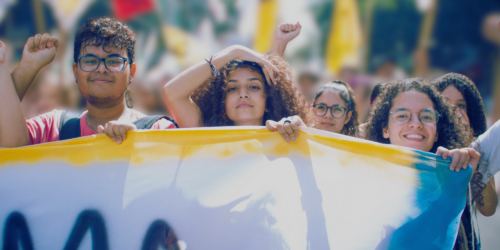
In this essay, originally published in the Journal of Democracy, Erica Chenoweth and Matthew Cebul analyze the global surge of Gen Z-led protest movements, showing how economic insecurity, exclusion from power, and corruption are driving youth mobilization worldwide.
Policy Brief
In this essay, originally published in the Journal of Democracy, Erica Chenoweth and Matthew Cebul analyze the global surge of Gen Z-led protest movements, showing how economic insecurity, exclusion from power, and corruption are driving youth mobilization worldwide.
Occasional Paper
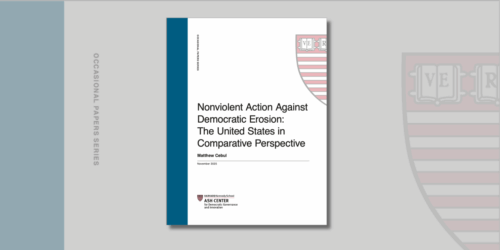
In this report, Matthew Cebul, Lead Research Fellow for the Nonviolent Action Lab, examines the effectiveness of nonviolent action movements in supporting democratic resilience globally. Identifying challenges faced by nonviolent pro-democracy movements, Cebul offers key takeaways for combating accelerating democratic erosion in the US and abroad.
Article
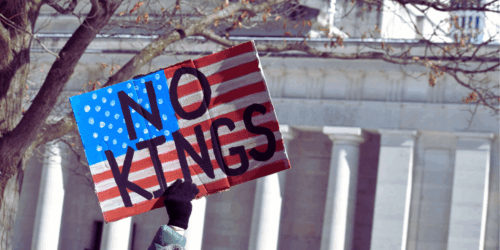
In this op-ed, Liz McKenna examines the second ‘No Kings’ protest on October 18 and offers strategies for translating successful protest movements into influential policy change. She emphasizes the importance of sustained organizational efforts alongside protest activity to engage actors across partisan lines, building a broad coalition and a durable base for the movement.