


Policy Brief
AI for Democracy Movements: Toward a New Agenda
A new report summarizes key insights from the Nonviolent Action Lab’s December 2025 convening on how artificial intelligence can empower pro-democracy movements.
![]()
Article
As organizers for No Kings 2 seek historic turnout on October 18, the broader pro-democracy movement has already broken new ground.
In recent articles, we’ve shared data about the widespread protests that have occurred so far during the second Trump administration. We’ve shared that the volume of protests has been far greater than during 2017, that the protest movement is overwhelmingly (and even historically) nonviolent, and that protests have been far-reaching, occurring throughout the United States on a regular basis. All of those trends continue to hold, and we expect large-scale participation in the No Kings 2 protests on October 18.
But one question that often arises is whether the protests are largely concentrated in major cities and liberal areas, or whether they have actually begun to occur in areas that the GOP dominates politically. The answer is important, since it gets to the heart of whether protests are largely trying to activate supporters in Democratic strongholds, or win over independents and lukewarm Trump supporters in tougher political terrain.
In a new analysis, we find that protest events now occur across a wider range of US counties than we have observed since January 2017. The share of counties hosting at least one anti-Trump protest has risen markedly during his second term, surpassing the historic spikes observed during his first term. And the current protest movement has already reached deeper into Trump country than at almost any point during the first Trump administration.
To analyze the geographic spread and scope of the current protest movement, we matched our data on protest events and protest participation from the Crowd Counting Consortium to county-level data on the 2024 presidential election, as well as to US Census data about county population size. Then we analyzed the number of counties that have featured any anti-Trump protests and any new protests during Trump’s first and second terms; the average electoral margins of those counties; and the number of reported participants per 10,000 people in each county population.
As usual, a couple of important caveats to keep in mind. First, our data contain records of reported events, not all events, with the understanding that patterns in reported events themselves can be revealing. Second, even for reported events, we do not always have information on participation size, so our analyses on participation are based only on those records for which we have a verified count. Third, our analysis does not account for changes over time in underlying political conditions or data collection methods over the last eight years of the project. Finally, for ease of comparison regarding different phases of the movement challenging the Trump administration’s policies, our analysis excludes observations from Biden’s term. You can access the replication data here, and general information about the CCC data and its limitations here.
All those caveats in place, here are some basic observations in three charts.
Protests in 2025 have reached a wider swath of the United States than at any other point on record. And the geographic reach of protest activity—the share of U.S. counties hosting at least one event—has remained remarkably high throughout the year.
Figure 1 displays the proportion of US counties that hosted at least one protest in each month of Trump’s first and second terms (depicted by the green x and blue triangle marks, respectively). The green trend line shows the moving average during Trump’s first term, and the blue line shows the moving average so far during Trump’s second term.
Figure 1: Proportion of US Counties with at Least One Protest, by Month
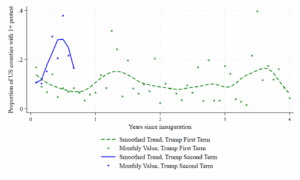
The largest monthly jumps of protest counties occurred in spring 2018, with the Enough Walkouts and the March for Our Lives in the month of March and the Walkout for Gun Control in April, and then again in June 2020, during the nationwide Black Lives Matter protests near the end of Trump’s first term. During the summer of 2020, demonstrations took place in just under 40 percent of all counties, during what was probably the broadest mobilization in US history up to that point.
But June 2025 came close to matching those historic levels, largely due to the No Kings mobilizations on June 14, with protests in nearly 38 percent of counties nationwide. Moreover, in 2025 protests have also expanded the movement’s footprint into new areas, even after the No Kings events of June. The cumulative number of counties that have ever hosted a protest has been climbing steadily since 2017, with noticeable surges in 2018 and 2020. A similar surge appears to be underway in 2025, pushing the cumulative share of protest-hosting counties well above 60 percent by June.
What’s most striking and novel, however, is the persistence of activity in 2025. The first eight months of the year have seen more sustained and geographically widespread protest than any comparable stretch in Trump’s first term—including the early waves of resistance in 2017 and the mass mobilizations of 2020. Protests occurred in at least 20% of US counties for four consecutive months in 2025–something we never observed during Trump’s first term. In short, the movement is not just continuing to spread into previously unrepresented parts of the country, but also maintaining its geographic reach.
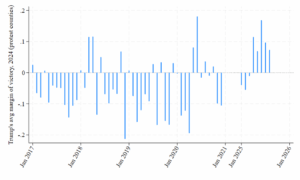
Figure 2 combines county-level data from the 2024 Presidential Election with monthly data on protest in each county. “Protest counties” are those that featured at least one protest in a month. Marks below zero on the y-axis represent months in which the typical protest happened in Harris-leaning counties, while marks above zero represent months in which the typical protest happened in Trump-leaning counties.
Figure 2 shows two big spikes of activity in which the protest movement reached deep into Trump country during his first term. One was the above-mentioned spikes related to gun control protests in spring 2018, and the other was the wave of protests associated with Black Lives Matter in 2020. Both of those spikes took place in counties that Trump won–on average–by more than 10 percentage points in 2024.
Figure 2: Average 2024 Electoral Margin for Trump Across All US Protest Counties, by Month
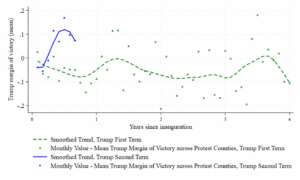
However, as the green line suggests, those key moments did not produce durable trends in protest activity in Trump country during the first term. Instead, during Trump’s first term, protests were concentrated in counties that ultimately went for Harris in 2024.
In 2025, we see a different picture. As the blue trend line suggests, only January 2025 saw protests concentrated in Harris-supporting counties (below zero on the y-axis), and February 2025 saw protests concentrated in counties where she won with a much slimmer margin. But from April to August 2025, the median protest county in the US sent more votes to Trump in 2024 than Harris. In fact, the number of protests in Trump-leaning areas in June 2025 was comparable to those in June 2020, during the height of the Black Lives Matter uprising. And unlike in 2020, that trend has held.
Figure 3 visualizes this pattern another way, showing the two brief spikes in protest in Trump country in 2018 and again in 2020, compared with the more durable presence of protest events in Trump-leaning areas through August 2025. (As with the above analyses, for comparability’s sake, the graph omits protest counts during Biden’s term, between January 2021 and January 2025).
Figure 3: Average 2024 Electoral Margin for Trump Across All US Protest Counties, by Month
Many of these protests have featured impressive numbers of participants. For instance, on No Kings Day on June 14, a protest in Kingsport, Tennessee saw an estimated 2,000 people lining almost a mile stretch of Center Street–close to 10% of that city’s population. Trump won the surrounding Sullivan County by 54 percentage points.
Among counties where we could confirm at least one event and establish a crowd count, the average total crowd size throughout the whole of Trump’s first term was about 40 protesters per 10,000 county residents, or 0.4%. In comparison, the average for Trump’s second term so far is about 65 protesters per 10,000 county residents, or 0.65%. This represents a 62.5% increase in average protest participation nationwide.
In general, anti-Trump protest participation in Trump country has also been greater during Trump’s second term, but the overall numbers tend to be smaller than the nationwide average. In counties Trump won by at least 5 percentage points, his first term saw an average total of 2 protesters per 10,000 residents per month, while his second term has seen an average of 7 protesters per 10,000 residents per month. Surges of participation–during which protest participation exceeded 19 protesters per 10,000 residents in Trump country–have also occurred in four months featuring nationwide actions: March 2018 (the Enough Walkouts and March for Our Lives), June 2020 (Black Lives Matter), April 2025 (Hands Off), and June 2025 (No Kings). Two of those have happened so far this year alone.
Indeed, numerous counties that voted overwhelmingly for Trump in 2024 have featured significant participation, in relative terms. Over 80% of the voters in Edmonson County, KY voted for Trump in 2024. In March 2025, organizers reported that 150 people attended a protest at Mammoth Cave National Park as part of the Resistance Rangers protest against national park worker layoffs and federal cuts to national parks. That action represented the first protest recorded there during either of Trump’s terms.
Meantime, over 86% of voters in Hardin County, Texas voted for Trump in 2024. The county seat of Kountze, with a population of 2,125, also saw a protest in March 2025 at Big Thicket National Preserve as part of the Resistance Rangers day of action. Organizers reported that 25 people attended, constituting 1.2% of the town’s population.
In Harlan County, Kentucky, some 88% of ballots were cast for Trump. The town of Harlan saw one protest in July 2025 against the “Big Beautiful Bill,” with an estimated 20-30 participants, or between 1.1% and 1.6% of the town’s population. One counter-protester was arrested after pointing a gun at protesters.
Trump similarly won about 88% of the vote in Campbell County, WY. The county seat of Gillette has seen at least two protests so far in 2025: one on April 5th (Hands Off) with an estimated crowd of 75, and one on June 18th (No Kings) with an estimated crowd of 175–about 0.5% of the city’s population. A group of counter-protesters showed up during the No Kings protest; some heckled speakers while others hailed Hitler and chanted “Trump is King.”
Protests can be extremely impactful when they are part of broader organized and disciplined movements that build capacity to wield power. Indicators of a movement’s potential impact include its reach into uncharted territories, successful appeals to new constituencies, the ability to maintain nonviolent discipline, establishing and maintaining momentum, and the ability to elicit shifts in the behavior and priorities of those in positions of influence. In previous periods of American history, disciplined and coordinated protest movements have had decisive impacts on election outcomes, legislation, policy reform, public opinion, and more.
It is too early to speculate on how today’s emergent protest movement will impact the country’s political future. But here is what we do know: National days of action continue to draw millions of participants; the movement remains overwhelmingly peaceful; protests have sprung up in the most pro-Trump towns in the country; and each month features greater geographic reach than the last. Regardless of what happens on October 18, the emergent protest movement in the US has already made history on multiple dimensions.
Erica Chenoweth is the Director of the Ash Center’s Nonviolent Action Lab, the Academic Dean for Faculty Development, and the Frank Stanton Professor of the First Amendment at Harvard Kennedy School.
Dr. Christopher Wiley Shay is a Research Associate at Harvard Kennedy School’s Ash Center, contributing to the Crowd Counting Consortium’s (CCC) work on nonviolent civil resistance.
Jeremy Pressman is the Co-Founder and Co-Director of the Crowd Counting Consortium (CCC) and a professor of political science at the University of Connecticut.
Soha Hammam, former Democracy Visiting Fellow at Harvard University’s Ash Center for Democratic Governance and Innovation, is the Research Project Manager at the Nonviolent Action Lab’s Crowd Counting Consortium (CCC).
The views expressed in this article are those of the author(s) alone and do not necessarily represent the positions of the Ash Center or its affiliates.
Policy Brief
A new report summarizes key insights from the Nonviolent Action Lab’s December 2025 convening on how artificial intelligence can empower pro-democracy movements.
Additional Resource
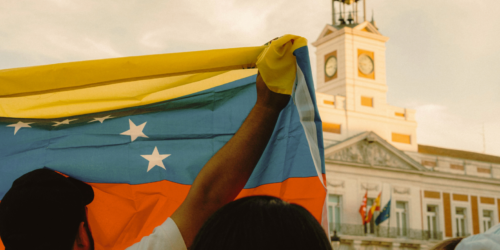
Even with Nicolás Maduro gone, the fight for Venezuela’s future is far from over. Freddy Guevara warns that Maduro’s successors are more interested in regime survival than democratic reform.

Policy Brief
In this essay, originally published in the Journal of Democracy, Erica Chenoweth and Matthew Cebul analyze the global surge of Gen Z-led protest movements, showing how economic insecurity, exclusion from power, and corruption are driving youth mobilization worldwide.
Policy Brief
In this essay, originally published in the Journal of Democracy, Erica Chenoweth and Matthew Cebul analyze the global surge of Gen Z-led protest movements, showing how economic insecurity, exclusion from power, and corruption are driving youth mobilization worldwide.
Occasional Paper
In this report, Matthew Cebul, Lead Research Fellow for the Nonviolent Action Lab, examines the effectiveness of nonviolent action movements in supporting democratic resilience globally. Identifying challenges faced by nonviolent pro-democracy movements, Cebul offers key takeaways for combating accelerating democratic erosion in the US and abroad.
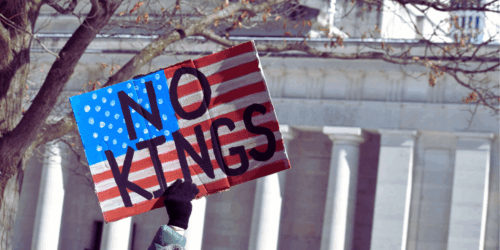
Article
In this op-ed, Liz McKenna examines the second ‘No Kings’ protest on October 18 and offers strategies for translating successful protest movements into influential policy change. She emphasizes the importance of sustained organizational efforts alongside protest activity to engage actors across partisan lines, building a broad coalition and a durable base for the movement.